COVID-19 data in Japan
I’ll start this entry by listing the resources I use for tracking the virus progress in Japan.
Official Government Source
https://www.mhlw.go.jp/stf/seisakunitsuite/bunya/0000164708_00001.html
The government site for the whole of Japan can be found here. It is all in Japanese however contains a one good source of data that doesn’t seem to be replicated elsewhere, at least in English.
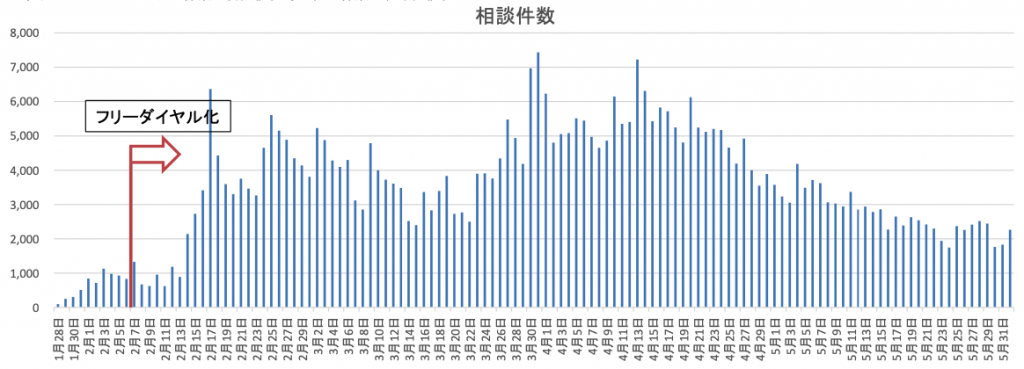
If you go here and search for “厚生労働省電話相談窓口(コールセンター)の対応状況等について” you will get a PDF link that changes each day showing a daily graph of calls to the coronavirus national hotline. Below is what is looked like for June 1st, with total calls hovering around the 2000 mark for the past week. This is a fairly representative view of how the virus is spreading nationwide. If things start to get out of hand, expect the numbers to push past 3000 a day. While February was also high, there was still influenza around to muddy the waters. By March that had died away so mostly the SARS2 signal will have been dominant. Any break through past 3000 now would signal a resurgence for sure.
Official Tokyo Dashboard
https://stopcovid19.metro.tokyo.lg.jp
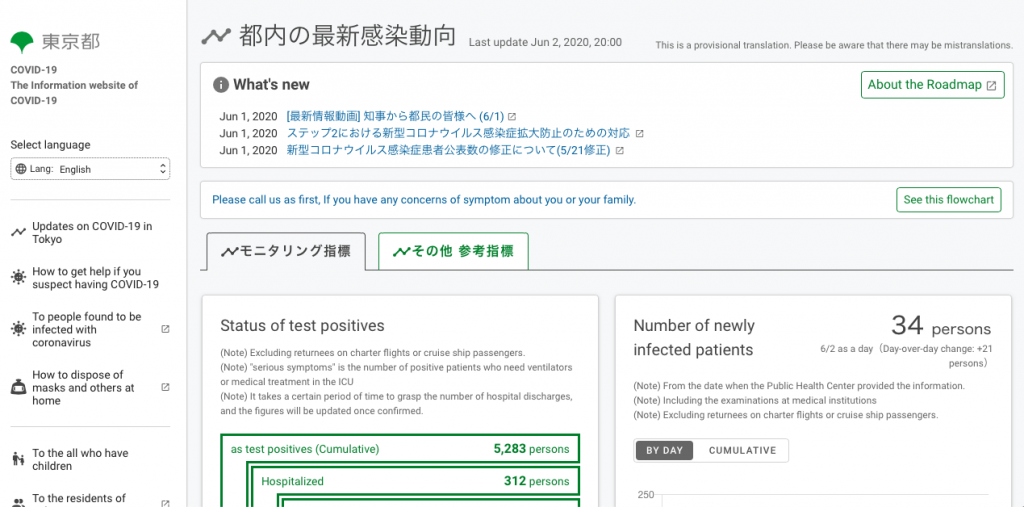
This is actually a nice looking dashboard with the various “criteria for opening up” listed out. As a individual worried about the virus, monitoring the charts daily is a waste of time – just be careful yourself by avoiding the 3Cs, wasting your hands and wearing a mask – but if you like gazing at charts, if they start to edge above the various blacks lines then expect another “strong request” from the government for restraint. As of June 1st the numbers were already heading back up in part due to hospital clusters. Trains and especially the busy night spots and drinking areas of Tokyo are pretty much back to normal. The June weather will mitigate but not significantly slow the spread without greater restraint.
NHK Virus Page
https://www3.nhk.or.jp/news/special/coronavirus/
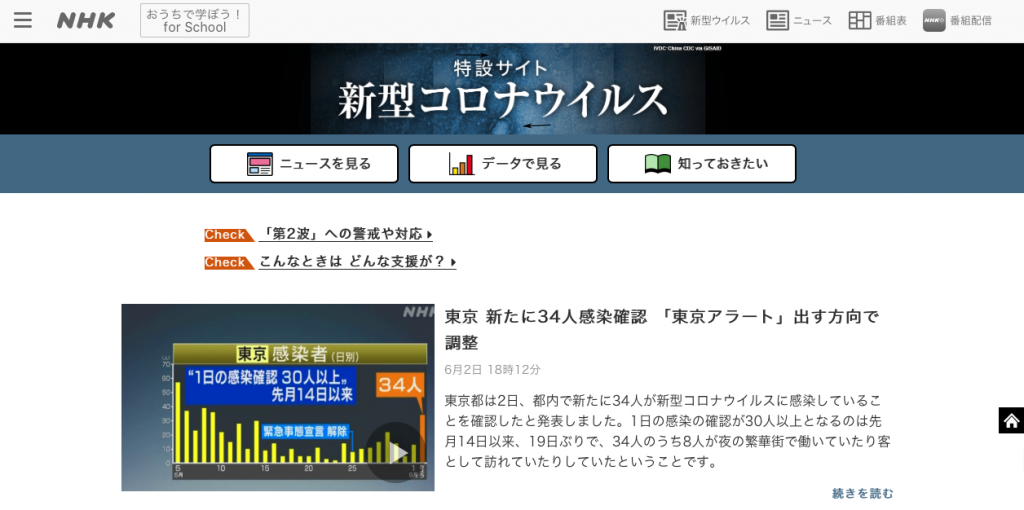
The official NHK homepage often has the quickest outline of all cases nationwide come late afternoon. It also has a nice table towards the end showing how close we are to tipping back into a state of emergency (現状はどうなっている). Lots of good statistics to help people feel like they are more in control (hint: you aren’t so stop looking everyday otherwise it’s just entertainment rather than news).
Covid-19 Japan Tracker
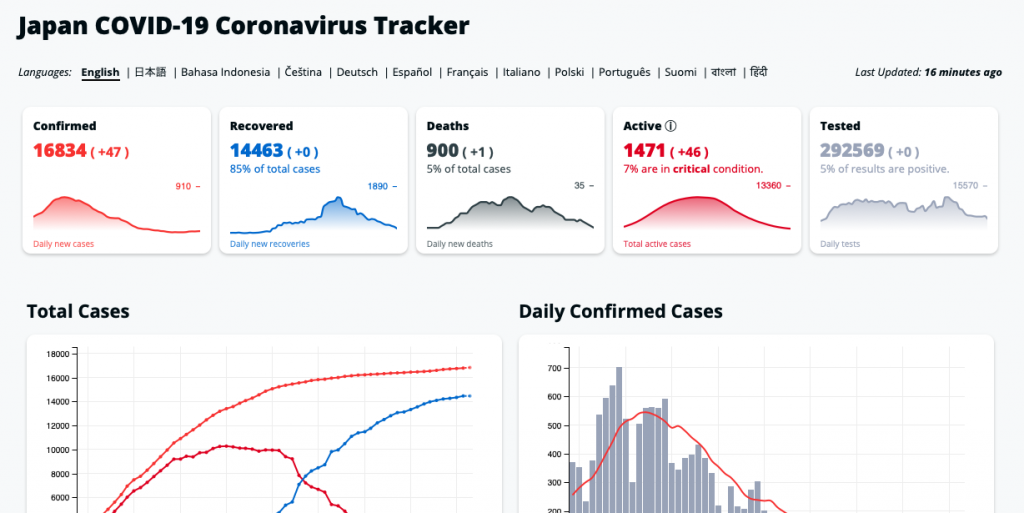
Lots of interesting graphs updated a bit at a time throughout the day, so you can get a jump on the stats in case it really is important that you know to-the-minute when the Tokyo numbers are out (get a jump on the panic buying? – hint: by now as you should have supplies just in case there is a major earthquake).
The bottom line
As we have seen around the world, the summer weather won’t save Japan from a second wave, although it is fairly safe to assume the higher temperatures and humidity plus strong sun (UV) will help to mitigate the spread compared to March. Tokyo will probably drift in and out of the danger zone as people wake up to the reality that the crowded indoor nightlife typical of Tokyo is just not practical unless you want uncontrolled spread.
Japan can beat the curve, and did so with minimum fuss, but it achieved this by basically shutting down everything fun. It is unknown what level of fun is acceptable in order to allow resuscitation of the nightlife and domestic tourist industry. Rural areas are especially hard hit economically but have been spared the worst of the virus, which is a blessing as many rural areas are close to 40% over 65s. I’m not sure how Japan can encourage domestic tourism (which is basically cities going to the countryside) while at the same time avoiding a surge of cases outside metropolitan areas.
I guess karaoke is cancelled this year?
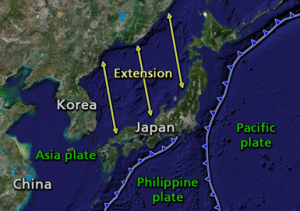
Next blog – are we all going to die in an earthquake instead? Covid+earthquake=Japan 2020?